

product Details
Explore More
Alternatives

About Chart Echo
Chart Echo is a specialized market analysis tool that enables traders and investors to search through approximately 450 million historical chart windows to find patterns that match the exact chart setup they are currently watching. The core premise of Chart Echo is that markets move in repeating patterns, and by studying how similar setups played out in the past, users can make more informed decisions based on precedent rather than speculation. The tool works across both stocks and cryptocurrencies, allowing users to overlay historical matches directly onto their current chart in gold, revealing how those past patterns continued after the match point. Chart Echo provides aggregate outcome statistics including the probability of rising or falling, average move size, and typical drawdown, giving users a data-driven perspective on the odds associated with their current setup. The product is designed for active traders who want to validate setups before taking positions, long-term investors who want to sanity-check breakouts or sell-offs against decades of historical data, and crypto watchers who recognize that digital assets tend to exhibit strong pattern repetition. Chart Echo emphasizes that it is not a prediction tool or financial advice, but rather a way to organize the markets own memory so users can study precedent in seconds instead of manually scrolling through years of historical charts. The tool is free to start with no account required, and it offers a guided five-step workflow that takes users from selecting a market to saving workspaces and sharing results.
Features
Historical Pattern Matching Engine
Chart Echo searches roughly 450 million historical windows across stocks and cryptocurrencies to find chart patterns that closely resemble the users current setup. The matching engine analyzes the shape of the chart the user is viewing and identifies historical moments that look most similar, ranking them by how strongly they rhyme with the current pattern. Each match includes a detailed explanation of why it was selected and how closely it aligns with the users chart.
Outcome Statistics and Precedent Analysis
For each historical match found, Chart Echo does not just show the pattern itself but also displays what happened next. The tool aggregates the continuations of all matching patterns to provide honest, data-grounded statistics including how often setups like this rose, fell, or went nowhere, the average move over subsequent periods, and the typical drawdown along the way. This gives users a clear picture of the odds based on actual market history.
Guided Five-Step Workflow
Chart Echo provides a single, guided path through the application that mirrors the mobile app experience. Users start by picking a market, then frame the timeframe and candle count that defines the pattern. The tool runs the search and presents a ranked list of historical echoes. Users can overlay any match in gold against their live pattern and read the outcome statistics, then save the workspace, set reminders, or share results as GIFs or images.
Multi-Asset Support Across Stocks and Crypto
Chart Echo works with both traditional stock markets and cryptocurrency markets, allowing users to search for patterns across a wide range of assets. For crypto users, the tool can match Bitcoin, Ethereum, and other major cryptocurrencies against their own past structures and across different assets to identify where todays chart has appeared before. This cross-asset capability provides a broader perspective on pattern repetition.
Use Cases
Pre-Trade Setup Validation for Active Traders
Before taking a trading setup, active traders can use Chart Echo to see the closest historical analogs to their current chart pattern. The tool shows how those similar setups resolved over the following days and weeks, including the probability of success, average move size, and typical drawdown. This allows traders to study real precedent before committing capital, reducing reliance on gut feelings or incomplete analysis.
Long-Term Investment Sanity Check
Long-term investors can use Chart Echo to sanity-check a breakout or a sell-off against decades of historical precedent instead of relying on a single analysts opinion. When a stock makes a significant move, investors can search for similar patterns from the past and see how they typically evolved. This provides a data-driven framework for making hold, buy, or sell decisions based on how the market has historically behaved in similar situations.
Crypto Pattern Analysis and Comparison
Crypto traders and investors can leverage Chart Echo to analyze patterns in Bitcoin, Ethereum, and other major cryptocurrencies. The tool recognizes that crypto markets often exhibit strong pattern repetition, and it allows users to match current crypto charts against their own historical structures as well as across different assets. This is particularly useful for identifying potential breakout or breakdown scenarios based on past crypto market behavior.
Educational Learning and Pattern Recognition Development
Chart Echo serves as an educational tool for traders and investors who want to develop their pattern recognition skills. By studying how historical matches align with current setups and seeing the actual outcomes, users can train their eye to identify repeating market structures. The ability to overlay historical charts on current setups provides a direct visual comparison that accelerates the learning process for recognizing meaningful chart patterns.
Frequently Asked Questions
How does Chart Echo find matching chart patterns?
Chart Echo uses a proprietary fractal matching engine that analyzes the shape of the chart you are viewing and searches across approximately 450 million historical windows in stocks and crypto. The engine compares the geometric structure of your current pattern against historical data to find the closest matches, ranking them by how strongly they rhyme with your setup. Each match includes details on why it was selected and how closely it aligns.
Is Chart Echo a prediction tool or financial advice?
No, Chart Echo is explicitly not a prediction tool and does not provide financial advice. It is a historical pattern matching tool that organizes the markets own memory so users can study precedent. The tool shows what happened in similar historical situations, but past performance does not guarantee future results. Users should always conduct their own research and consider multiple factors before making trading or investment decisions.
What assets are supported by Chart Echo?
Chart Echo supports both stocks and cryptocurrencies. Users can search for patterns across traditional stock markets as well as major cryptocurrencies like Bitcoin and Ethereum. The tool allows for cross-asset matching, meaning you can compare a pattern from one asset against historical patterns from other assets. The database covers roughly 450 million historical windows across these markets.
Do I need to create an account to use Chart Echo?
No, Chart Echo is free to start with no account required. Users can try the tool immediately without signing up. Creating an account unlocks additional features such as saved workspaces, while a Premium subscription adds Pro Mode, saved-setup reminders, intraday timeframes, alerts, and watermark-free exports. The basic functionality of searching for historical matches and viewing outcome statistics is available without an account.
Similar to Chart Echo
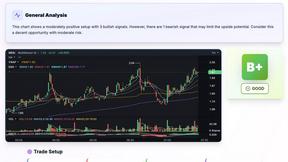
SnapPChart
SnapPChart grades a trading chart screenshot A+ to F, with an entry, stop, targets, and risk/reward. Works on stocks, forex, crypto, futures.

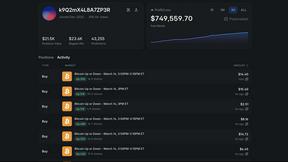
Polymarket Trading Bot For Crypto
An automated trading bot for Polymarket that executes high-frequency arbitrage and hedging strategies on 5-15 minute crypto markets.