KPI Studio
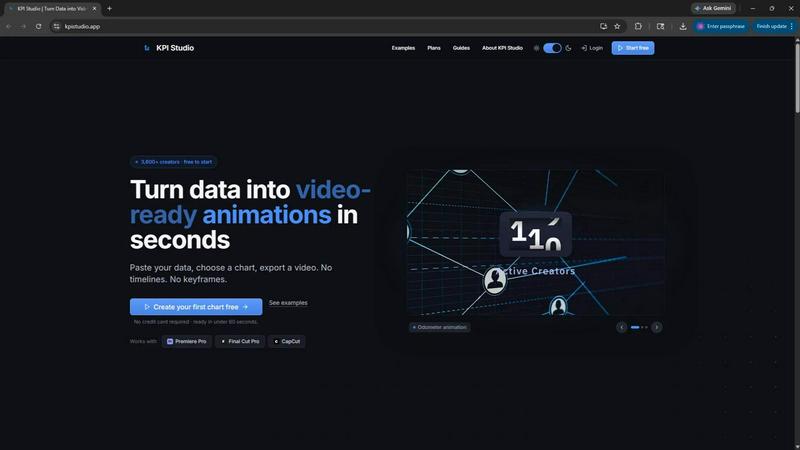
KPI Studio lets you paste data, customize a chart, and export a polished video in under 60 seconds without timelines or keyframes.
product Details
Explore More
Alternatives
About KPI Studio
KPI Studio is a specialized software tool designed for data-driven video creators who need to incorporate animated charts and metrics into their content quickly and efficiently, without requiring any motion design skills. The product addresses a fundamental workflow problem: traditional methods for adding data visualizations to videos are either too slow, too amateur, or too expensive. Screenshots look unprofessional, Canva templates lack flexibility, Adobe After Effects requires hours of complex keyframing, and hiring freelancers introduces delays and costs. KPI Studio eliminates this entire process by enabling users to paste their data, choose a chart type, and export a fully animated, video-ready visual in under 60 seconds. The tool is built for creators on a publish schedule, including YouTubers, social media managers, business analysts, and e-learning developers. Its core value proposition is speed and precision: no timelines, no keyframes, no setup. Exports include transparent background support, allowing charts to drop directly into editing timelines like Premiere Pro, Final Cut Pro, and CapCut with zero additional editing. For advanced workflows, JSON export enables deeper customization and integration into custom pipelines. With over 3,600 creators already using the platform, KPI Studio has established itself as a practical solution for turning raw numbers into engaging, professional motion graphics.
Features
Three-Step Workflow
The entire process from data to video is streamlined into three simple steps: paste your data, customize the chart appearance, and export for video. This eliminates the need for any timeline-based editing, keyframe manipulation, or complex software setup. Users simply input their numerical data, select from available chart types, adjust colors and styles through intuitive controls, and the tool automatically generates a polished animated visual. If data changes, users can re-export instantly without redoing any work. This workflow is designed to be completed in under 60 seconds, making it ideal for creators who need to produce multiple data-driven segments quickly.
Multiple Export Formats and Aspect Ratios
KPI Studio supports a comprehensive range of export formats to fit any editing workflow. Users can export animated visuals as MP4, MOV with transparency, GIF, and PNG sequences. Transparent background options are available for MOV, GIF, and PNG exports, allowing charts to overlay seamlessly onto existing video footage without manual masking or compositing. The tool also offers multiple aspect ratios including 16:9 widescreen, 1:1 square, 9:16 stories, and 4:3 standard, ensuring compatibility with platforms like YouTube, Instagram, TikTok, and presentation software such as PowerPoint and Google Slides. JSON export is available for users who need programmatic control or integration into custom pipelines.
Animated Chart Types
The platform provides several professionally animated chart types designed specifically for video content. Count-up numbers animate milestone metrics like subscriber counts, revenue totals, or progress indicators as they increment on screen. Growing bar charts reveal comparative data across competitors, time periods, or product lines with bars rising smoothly. Drawing line charts show trends over time, such as revenue growth or audience expansion, with lines that appear to draw themselves. Each animation is pre-optimized for visual impact and clarity, ensuring that data is communicated effectively without requiring any manual animation work from the user.
Seamless Editing Integration
KPI Studio is built to work directly with major video editing software. Exported files with transparent backgrounds can be dropped straight into Premiere Pro, Final Cut Pro, or CapCut without any additional editing steps. This integration saves significant time compared to traditional workflows that require rendering out elements, masking backgrounds, or adjusting compositing settings. The tool also supports direct use in presentation software like PowerPoint and Google Slides, making it versatile for both video and live presentation contexts. This feature is particularly valuable for creators who produce content across multiple platforms and need consistent, professional data visualizations.
Use Cases
YouTube Content Creation
YouTube creators who produce data-driven content such as channel analytics reviews, market analysis, or educational videos can use KPI Studio to generate animated charts that enhance viewer engagement. Instead of showing static screenshots or spending hours in After Effects, creators can quickly produce professional count-up counters for subscriber milestones, bar charts comparing video performance, or line charts showing growth trends. The transparent background exports allow these elements to be overlaid directly onto video footage, creating a polished, broadcast-quality look that keeps viewers watching longer. This is especially useful for creators who publish weekly and need to maintain a consistent, high-quality visual style without investing excessive time in motion design.
Social Media Short-Form Videos
Social media managers and content creators producing short-form videos for platforms like Instagram, TikTok, and YouTube Shorts can leverage KPI Studio to create eye-catching data animations. The 9:16 aspect ratio support is ideal for vertical video formats, and the animated visuals help capture viewer attention in crowded feeds. Count-up animations showing milestones, engagement metrics, or growth statistics perform particularly well in short-form content, where dynamic visuals increase retention and sharing. The ability to export in GIF format also allows for easy integration into social media posts and stories without requiring video editing software.
Business Presentations and Reports
Professionals who need to present data in video format for internal reports, client pitches, or investor updates can use KPI Studio to create polished animated visuals quickly. Instead of relying on static slides or complex presentation software animations, users can generate professional bar charts, line graphs, and counter animations that make data more memorable and impactful. The exports work seamlessly with PowerPoint and Google Slides, allowing presenters to embed animated data directly into their slide decks. This is particularly valuable for quarterly business reviews, sales performance updates, and project milestone presentations where data clarity and visual impact are critical.
E-Learning and Educational Content
Educators, course creators, and instructional designers producing video-based learning materials can use KPI Studio to illustrate statistical concepts, historical trends, or performance metrics in an engaging way. Animated charts help learners visualize data changes over time, making abstract numbers more concrete and easier to understand. The tool's simplicity allows educators to create multiple data visualizations for a single course module without requiring extensive video editing skills. Transparent background exports enable these charts to be overlaid onto presentation slides or live-action footage, creating professional educational content that maintains student attention and improves information retention.
Pricing
KPI Studio offers three pricing tiers designed to accommodate different usage levels. The Free plan costs $0 per month and includes unlimited PNG exports, three free animated exports, access to all chart types, and real-time preview. This plan is ideal for trying the tool on your next video project without requiring a credit card. The Creator Pack is a one-time purchase for $11.99 and includes everything in the Free plan plus ten video exports in GIF, MP4, WebM, and MOV formats, no watermark, 1080p export resolution, and no expiry on credits. This plan is perfect for client projects, YouTube videos, and deadline-driven edits. The Pro plan is the most popular option at $19.99 per month and includes everything in the Free plan plus unlimited video exports in all supported formats, no watermark, 4K export resolution, and the ability to cancel anytime. This plan is built for creators who publish every week and need unlimited access to professional animated charts.
Frequently Asked Questions
How long does it take to create an animated chart with KPI Studio?
The entire process from pasting your data to exporting a finished animation typically takes under 60 seconds. There are no timelines to configure, no keyframes to set, and no complex software to learn. Users simply input their data, customize the chart appearance through intuitive controls, choose their desired export format and aspect ratio, and the tool generates the animated visual instantly. If the underlying data changes, users can re-export the chart in seconds without redoing any work.
What export formats and resolutions are supported?
KPI Studio supports MP4, MOV with transparency, GIF, and PNG sequence exports. Transparent background options are available for MOV, GIF, and PNG formats, allowing charts to overlay directly onto video footage. Users can export at resolutions up to 1080p with the Creator Pack and up to 4K with the Pro subscription. The tool also supports multiple aspect ratios including 16:9, 1:1, 9:16, and 4:3, ensuring compatibility with various platforms and editing workflows.
Can I use KPI Studio charts in video editing software?
Yes, KPI Studio is specifically designed for seamless integration with major video editing applications. Exported files with transparent backgrounds can be dropped directly into Premiere Pro, Final Cut Pro, and CapCut without any additional editing or compositing work. The tool also supports direct use in presentation software like PowerPoint and Google Slides. This integration eliminates the need for manual masking, background removal, or complex layering, saving significant time in the post-production workflow.
What happens if my data changes after I export a chart?
If your underlying data changes, you can simply update the data in KPI Studio and re-export the chart in under 60 seconds. There is no need to redo any animation work, adjust keyframes, or reconfigure settings. The tool remembers your previous chart customization choices, so you can make data updates while maintaining consistent visual styling across all your exports. This is particularly valuable for creators who need to update metrics regularly, such as subscriber counts, revenue figures, or performance benchmarks.
Similar to KPI Studio
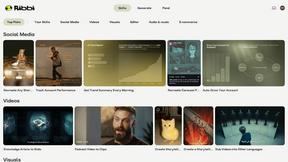
Ribbi
Ribbi is an AI-driven tool that automates social media content creation and management, enhancing engagement and growth effortlessly.

ChatGPT Image 2
ChatGPT Image 2 is an all-in-one workspace for AI image editing, generation, and video creation with commercial-grade output.
Editly AI
Editly AI is an intelligent video editing agent that transforms raw footage into polished edits in minutes using simple text prompts.